Web Performance
Web performance is all about making websites fast, including making slow processes seem fast
In essence, web performance is about both the measurable aspects and the user’s perceived experience when interacting with a site or app
Key areas include
Reducing Load Time: This involves minimizing the size and number of files needed to render a website, and using techniques like preloading to speed up the process.
Usability from the Start: We focus on loading website assets efficiently, enabling users to start interacting with the site quickly. Techniques like lazy loading enhance this experience.
Smoothness and Interactivity: A seamless user experience is crucial. We explore best practices in creating smooth animations and responsive interfaces.
Perceived Performance: It’s not just about how fast a website loads, but how fast it feels to the user. Strategies like engaging loading screens can significantly improve user perception.
Performance Measurements: We delve into various metrics and tools for measuring and optimizing web performance, ensuring that the site not only performs well but continues to do so over time.
How content is rendered
How the browser works. When you request a URL and hit Enter / Return , the browser finds out where the server is that holds that website’s files, establishes a connection to it, and requests the files.
Source order. When a browser reads your index file, it usually downloads additional files one after the other, following the order they appear in the code. However, this order can be changed to improve performance. It’s important to optimize it, as some files may delay the download of others until they are fully processed and executed.
Critical path. This is how the browser puts together the web page after getting the files from the server. The browser has specific steps it follows, and if we make sure to prioritize showing the most important content related to what the user is doing, it will make the web page load much faster.
DOM. The Document Object Model (DOM) connects web pages to scripts or programming languages by representing the structure of a document—such as the HTML representing a web page—in memory. Usually it refers to JavaScript, even though modeling HTML, SVG, or XML documents as objects are not part of the core JavaScript language.
Latency Latency is generally considered to be the amount of time it takes from when a request is made by the user to the time it takes for the response to get back to that user.The latency associated with a single asset, especially a basic HTML page, may seem trivial. But websites generally involve multiple requests: the HTML includes requests for multiple CSS, scripts, and media files. The greater the number and size of these requests, the greater the impact of high latency on user experience.
Maintaining optimal performance is relatively straightforward for basic websites. However, the task becomes more challenging with intricate web applications, where delivering a consistently smooth user experience is crucial.
The problem that exists is that while our website may behave as expected on our devices, our users won’t be accessing the device from our devices, but their own and under different circumstances.
In light of this, I have put together a selection of key metrics that are essential for evaluating the performance of websites
1. First Contentful Paint (FCP)
This performance metric, known as First Contentful Paint (FCP), gauges the time taken for the initial piece of content on a website - be it text, images, or other elements - to appear on the user’s screen.
FCP measures how long it takes the browser to render the first piece of DOM content after a user navigates to your page. Images, non-white canvas elements, and SVGs on your page are considered DOM content; anything inside an iframe isn’t included.
FCP plays a significant role in shaping a user’s perception of the page’s loading speed, making its optimization vital.
It’s important to aim for an FCP of 1.8 seconds or less for client websites to ensure optimal performance.
2. First Meaningful Paint (FMP)
Sounds pretty similar to First Contentful Paint (FCP), right? There’s a key difference.
As the name suggests, FMP is how long it takes for the first meaningful content to display (i.e., whatever users actually want to view).
This value is often the same as First Contentful Paint (FCP) but varies based on your client’s website.
3. Largest Contentful Paint (LCP)
This perceived performance metric is the time it takes for the largest piece of content to load on your client’s website (e.g., a video embed, image slideshow, text body).
It’s worth noting that LCP falls under Google’s Core Web Vitals, which means it directly impacts a website’s performance on Google search results.
It makes sense when you think about it. LCP is useful for a website visitor to gauge how long they’ll have to wait to access your client’s full website (which often determines whether they’ll stay or not).
When you measure LCP either using Lighthouse or PageSpeed Insight, it usually provides a list of reasons why your LCP was given a certain score and how you can optimize for it. Some of the common things you can do to optimize for LCP. Optimize Server Response Time
To speed up your website, use a Content Delivery Network (CDN) for your images, CSS, JavaScript, HTML, and static files. This helps with caching and improves a metric known as Time To First Byte (TTFB), which is the time it takes to receive the first byte of data from the server. TTFB affects key performance metrics like Largest Contentful Paint (LCP) and First Contentful Paint (FCP).
Enhance Resource Discovery Load critical resources affecting LCP as soon as possible. Browsers have a preload scanner that prefetches items like images and stylesheets marked with rel=preload. Ensure your images’ URLs are in the srcset or src attributes, and preload CSS background images and fonts.
Prioritize Key Resources Ensure important resources load first. Use the fetchpriority="high" attribute for essential images. De-prioritize less critical resources to conserve bandwidth.
Other Optimizations
- Switch to modern image formats like WebP, ideally using an image CDN for format compatibility.
- Implement responsive images to suit different screen sizes.
- Compress images to reduce size without losing quality.
- Set appropriate cache settings to minimize repeat load times.
- Eliminate unnecessary CSS and JavaScript.
- Optimize font sizes for efficiency.
4. Cumulative Layout Shift (CLS)
Similar to Largest Contentful Paint, CLS also falls in the Google Core Web Vitals bucket. Users often find it annoying when content they are reading suddenly shifts to a different spot on the page. This can happen due to images loading and pushing down existing content or dynamic additions like ads that force content to move.
As developers, we might not notice these shifts easily, especially if we’re using fast internet connections where images load quickly or are already cached, making our testing less representative of actual user experience.
Cumulative Layout Shift (CLS) is a crucial metric that tracks these unexpected layout shifts over a webpage’s life. A layout shift happens when visible elements move abruptly. CLS gives insight into how frequently this occurs on a webpage.
There are two kinds of layout shifts:
- Unexpected Layout Shift: This is unintentional and occurs without the developer’s design intent. It negatively impacts the user experience.
- Expected Layout Shift: This is intentional, usually triggered by user actions, like clicking a button to reveal more content or animations.
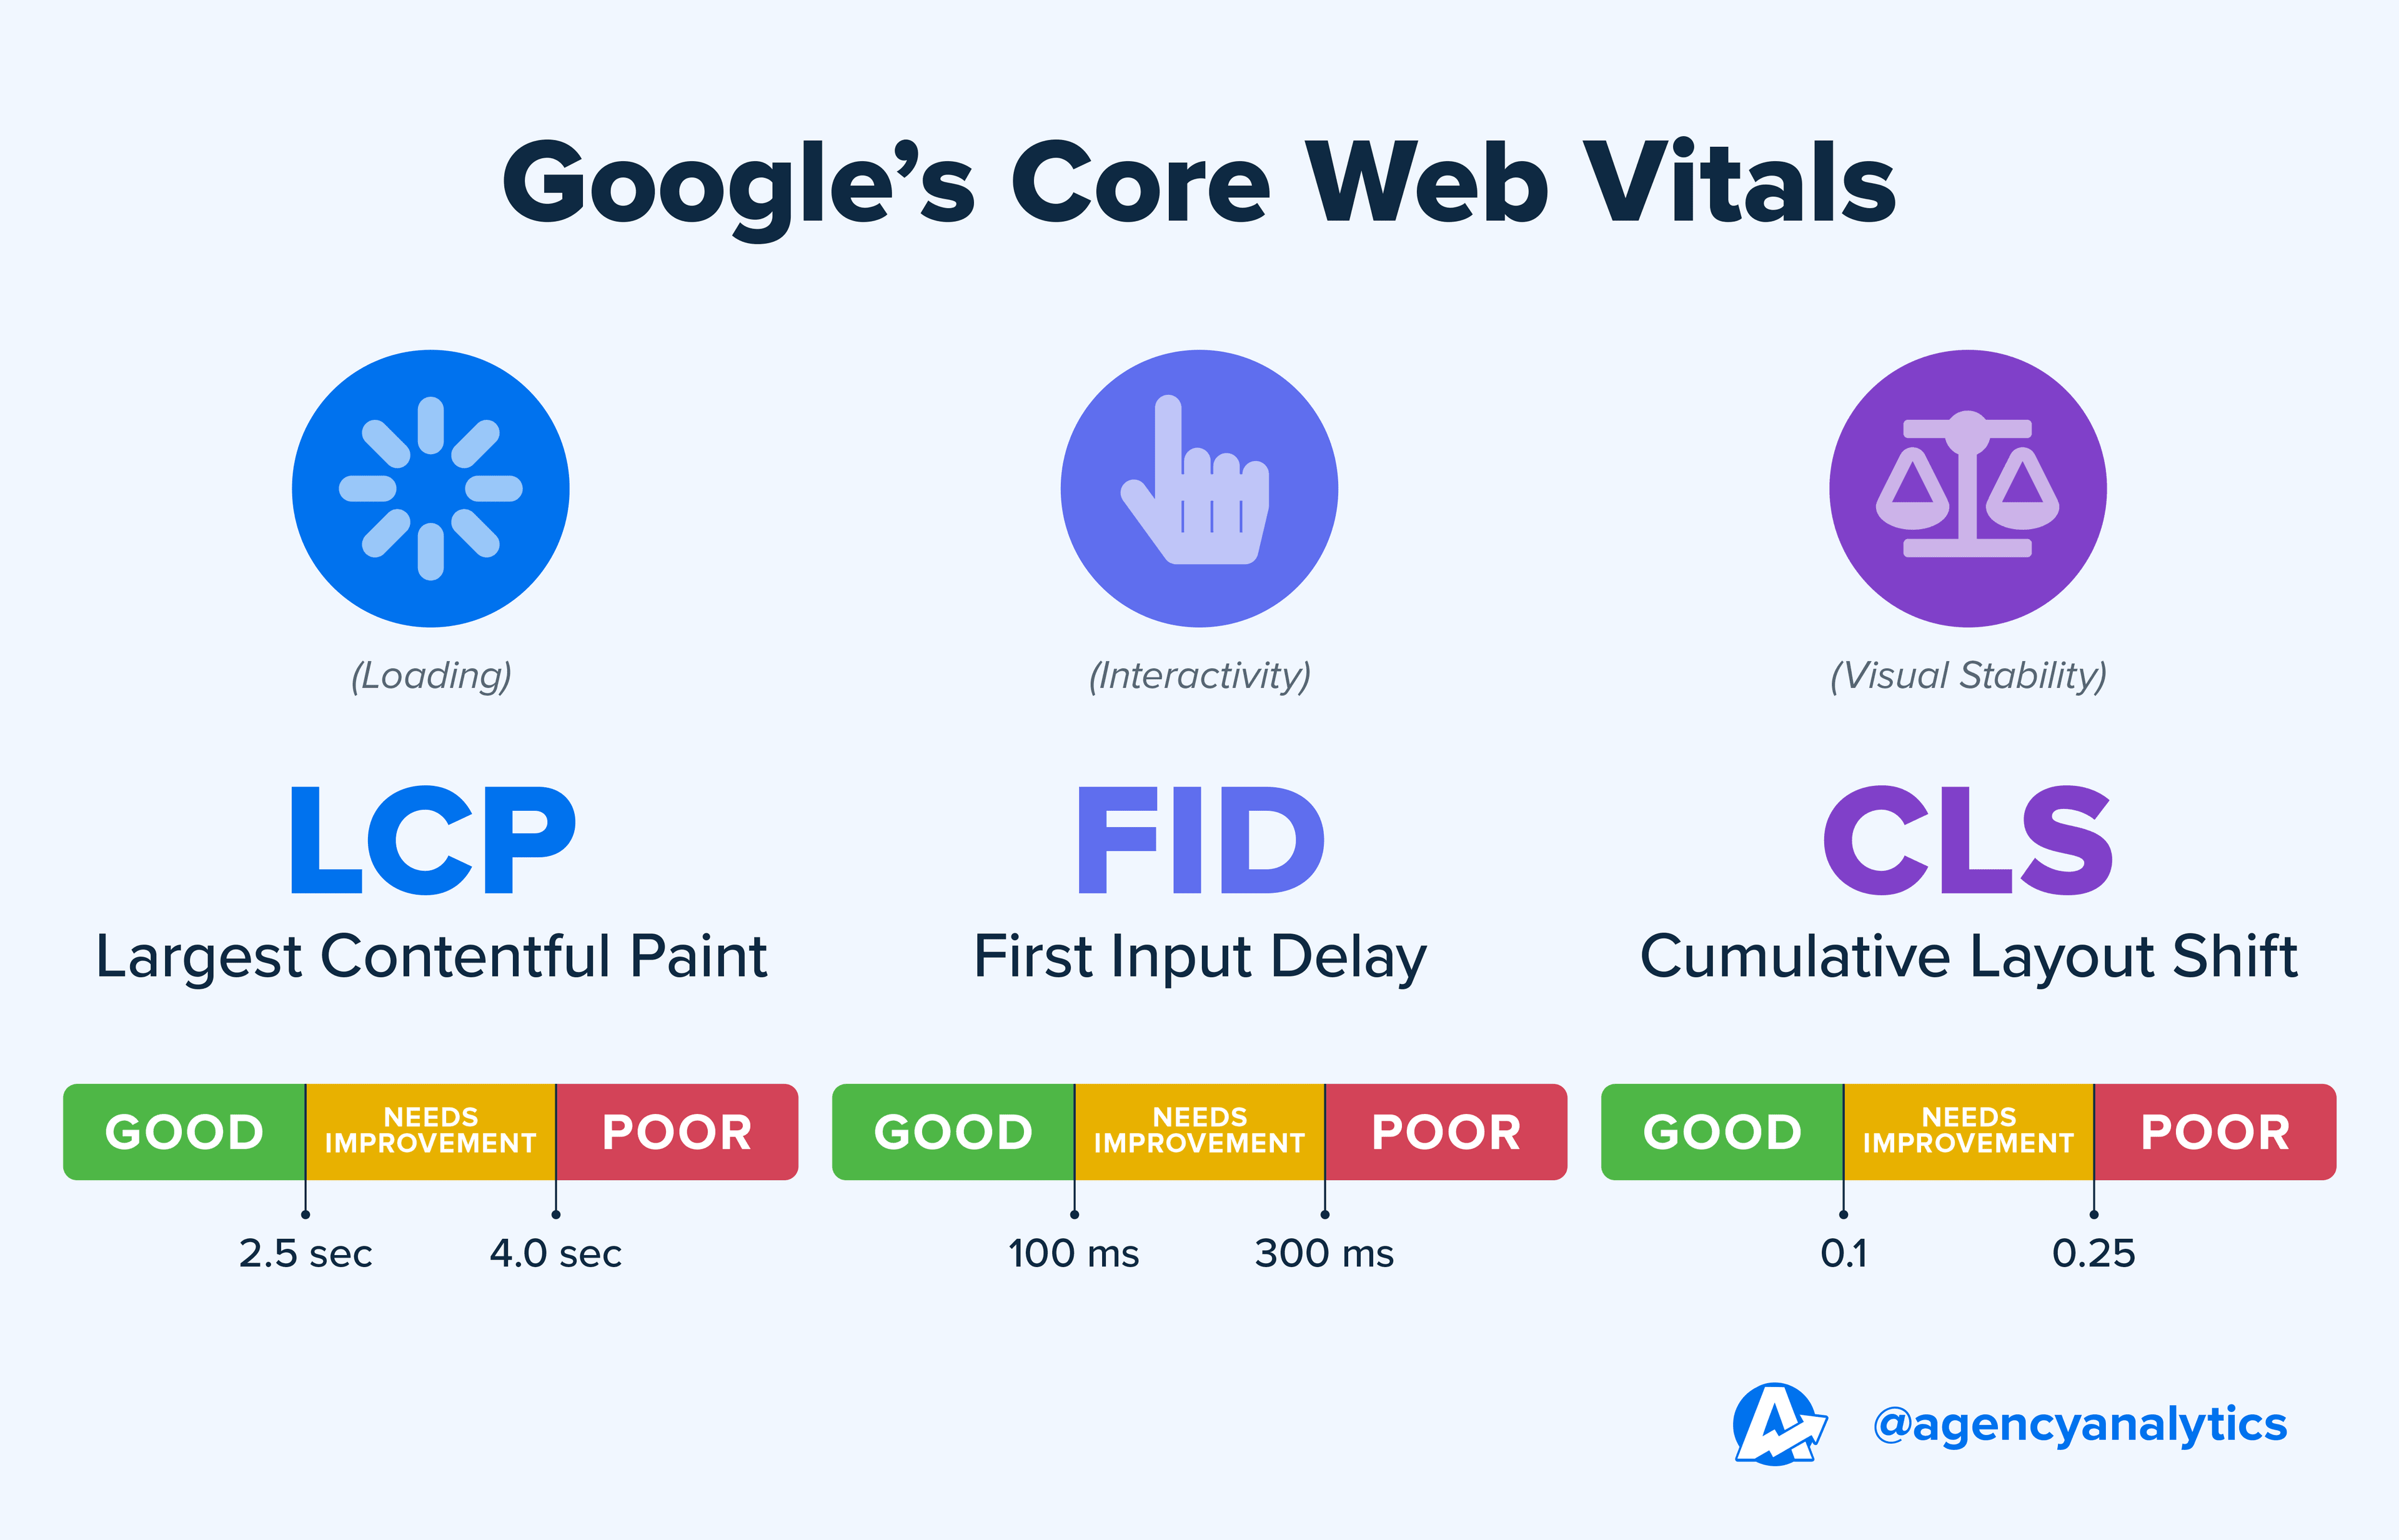
The goal is to have no layout shifts on your webpage. However, a CLS score of 0.1 or less for 75% of all page loads is considered acceptable.
To optimize for CLS, ensure that all your images have a fixed height and width, or add aspect ratio to them, so that the browser can reserve a place for them in the rendered page.
5. First Input Delay (FID)
Wrapping up Google’s Core Web Vitals is First Input Delay (FID). Have you ever been to a website where, after it finished loading, there was a noticeable delay when you tried to click a link or a button? This delay is what First Input Delay (FID) measures. FID tracks the time it takes for a webpage to respond to user interactions like clicks, taps, or key presses while it’s still loading. To achieve a good FID score, the response time should be 100 milliseconds or less.
To enhance First Input Delay (FID), focus on these key optimizations: Minimize the initial load of JavaScript, use Web Workers for complex tasks to free up the main thread, implement on-demand script loading, defer non-critical scripts with the defer attribute, employ code-splitting and lazy loading techniques for efficient script management, and reduce the usage of pollyfills to lighten the JavaScript load.
Summarized visual for the above metrics.
More Metrics
6.Page Load Time This metric measures how long it takes for your client’s website to fully render on a user’s screen after their initial click.
7.Time to First Byte (TTFB) TTFB is the duration it takes for a user’s browser to obtain a data byte from a web server following a user’s initial click. As a benchmark, aim for a time to first byte of no more than 600 milliseconds.
8.Speed Index Speed Index is the rate at which a webpage loads progressively over time. In contrast to FCP, this metric considers the entire page loading process rather than solely focusing on one part.
9.Time to Interactive (TTI) TTI is the time it takes for your client’s website to become responsive to user interactions (e.g., getting a successful response after clicking a ‘Download’ button).
While you can’t technically control how your visitors behave on your site, you certainly can optimize content to drive behavior.

